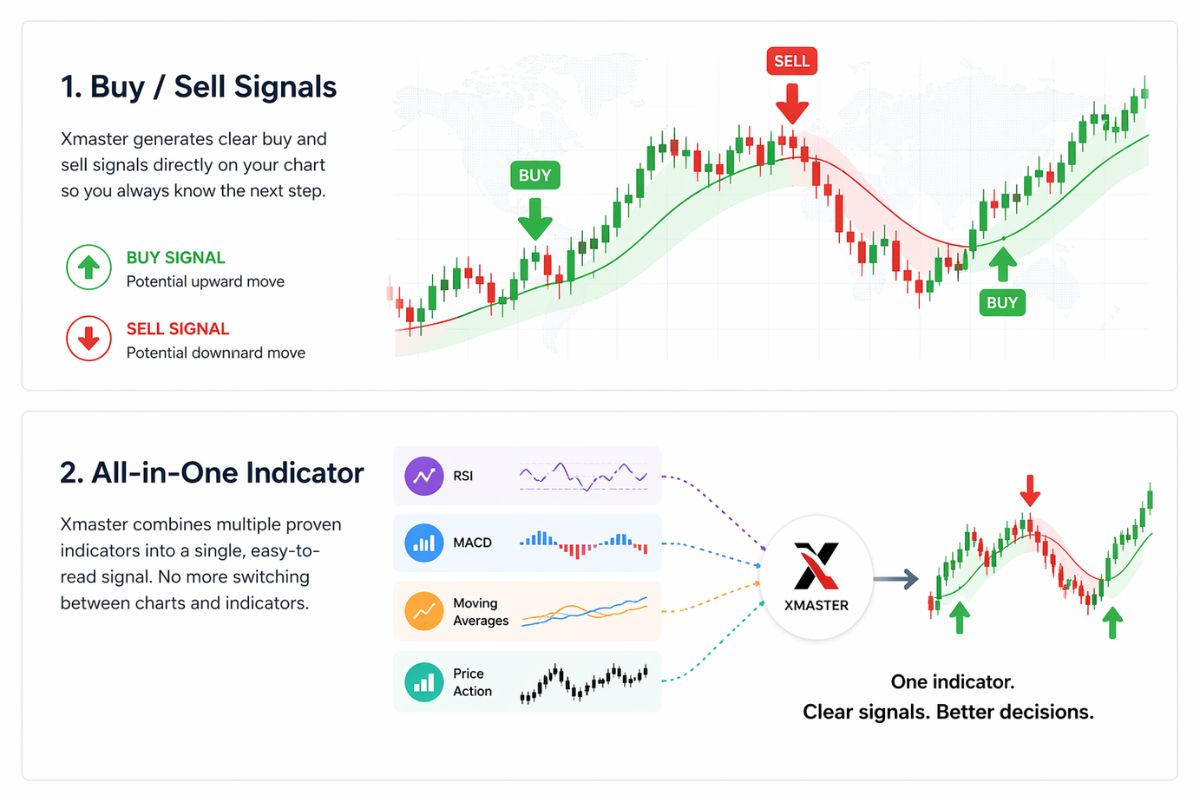
The Xmaster Formula Indicator is a custom-built tool for forex (and other) charts, designed to simplify technical analysis by combining multiple established indicators into one unified overlay. Compared with using separate moving averages, oscillators or volatility bands, Xmaster aims to deliver a single clear signal often in the form of coloured lines and arrows when several conditions line up.
Behind the scenes, Xmaster analyses trend direction (via moving averages or smoothing), momentum and market strength (via oscillators like MACD, RSI, or Stochastic), and sometimes volatility or overbought/oversold conditions. When those pieces align trend, momentum, and strength the indicator issues a signal (commonly a green cue for bullish trend and red for bearish). The result is a simplified visual summary of complex data, helping traders see potential trade opportunities without cluttering their charts.
Because Xmaster can run on popular platforms such as MetaTrader 4 (MT4) or MetaTrader 5 (MT5), many traders adopt it as a base tool to gauge market direction.
How the Xmaster Formula Indicator Works
Although the exact internal coding varies between versions, the typical logic flow of Xmaster runs like this:
By combining multiple indicators, Xmaster reduces the need for multiple chart overlays. Instead of showing five or six separate signals, you get one clean output: trend + momentum + volatility filtered into a single, easy to read form.
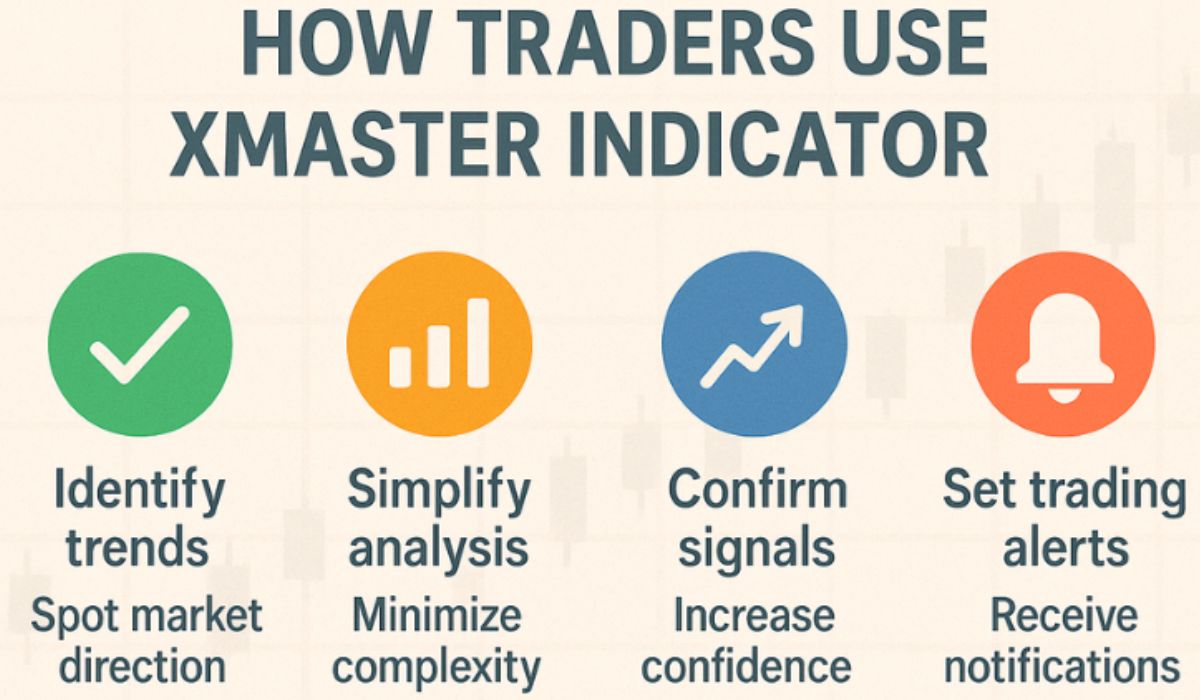
How Traders Use Xmaster
Traders with different styles, from swing traders to day traders, use Xmaster in various ways. Common approaches include:
Strengths: What Xmaster Does Well
The Xmaster Formula Indicator offers several advantages that make it appealing, especially for traders seeking clarity and simplicity:
For many traders, especially those who want clean charts, structured signals, and consistent analysis, Xmaster offers a practical balance between complexity and usability.
Limitations & Risks: Where Xmaster Falls Short
Xmaster is not perfect. It has limitations, and using it without care or context can lead to poor trading outcomes. Key drawbacks include:
In short: Xmaster can help. But it should never replace sound judgement, proper risk controls, and real market awareness.
How to Use Xmaster Effectively: A Practical Approach
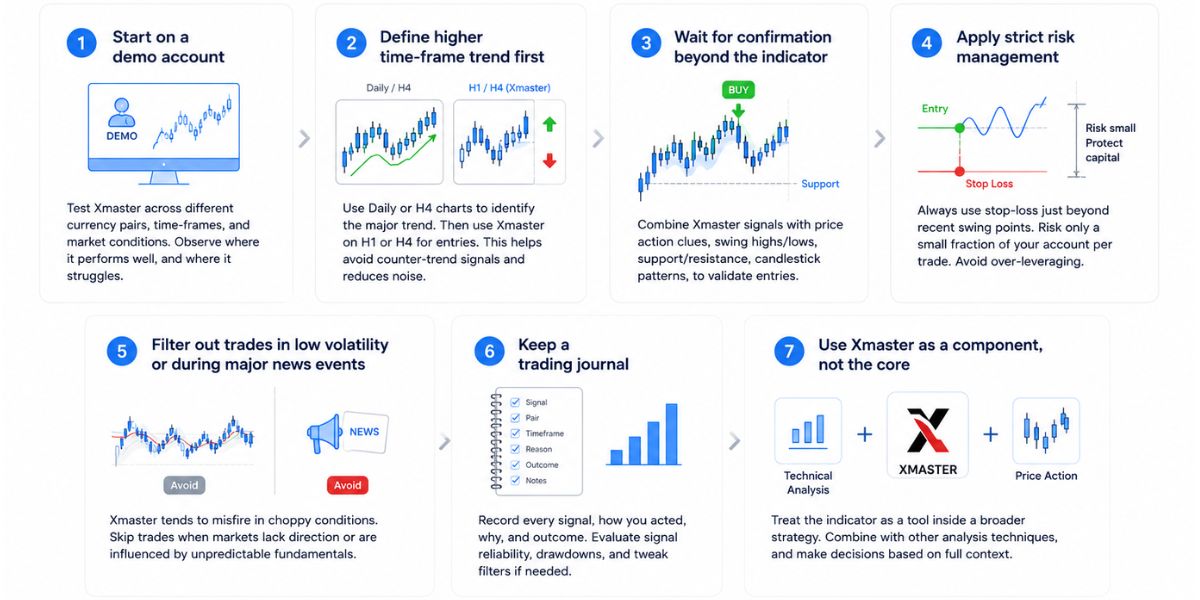
If you plan to incorporate Xmaster into your trading setup, here is a disciplined framework that reflects best practices:
This disciplined approach helps you treat Xmaster as what it is: a helpful guide, not a guarantee.
Who Might Benefit and Who Should Be Careful
Good candidate traders:
- Beginners or intermediate forex traders who want a simplified charting setup.
- Swing‑traders or trend‑followers using H1, H4, or Daily timeframes.
- Traders who manage multiple pairs or markets and want quick signal filtering.
- Those who prefer structure and clarity over complex chart clutter.
Traders who should be careful or avoid depending on Xmaster alone:
- Scalpers or ultra‑short‑term traders, indicator lag may compromise entries.
- Traders operating during low volatility, sideways markets, or unpredictable macro events.
- Traders without strict risk management or who rely only on indicator signals.
- Users trading exotic or highly volatile pairs that often produce noise rather than clear trends.
Difference Between Xmaster and XHMaster Indicators
While many traders treat Xmaster and XHMaster as the same, there are practical differences between the two, especially when it comes to how they behave in real trading conditions.
| Feature | Xmaster Indicator | XHMaster Indicator |
|---|---|---|
| Signal Speed | Fast and reactive | Slower but more stable |
| Best Suited For | Scalping and intra-day trading | Swing and longer intra-day positions |
| Noise Level | Higher, more false signals | Lower, filters out more noise |
| Adaptability | Less adaptive across time-frames | More consistent across time-frames |
| Design Approach | Classic signal formula | Updated design with no repaint logic |
Xmaster tends to produce faster signals, which makes it appealing to those who prefer scalping or short intra-day setups. The signals appear quickly, but this speed can also come at the cost of more false positives, especially in sideways or choppy markets. It is built on a classic formula that prioritises responsiveness over refinement.
XHMaster on the other hand is often viewed as a smoother, more filtered version. It is better suited for swing or day traders who value signal stability. It generally filters out more market noise and offers a slower signal response, which can help avoid being whipsawed by small price movements. Many versions also include no repaint logic, which improves reliability in back-testing and live trades.
In terms of adaptability, XHMaster tends to perform more consistently across a wider range of time-frames and currency pairs. Xmaster is less adaptive but remains useful in fast-moving conditions where speed matters more than precision.
Both serve a similar purpose but are tuned for different styles. Choosing between them depends on your preferred timeframe, strategy and tolerance for market noise.
Xmaster & XHMaster: Final Observations
The Xmaster Formula Indicator for Forex offers a straightforward, accessible bridge between complex technical analysis and practical trading. By bundling trend detection, momentum assessment, and volatility/strength filtering into one visual overlay, it makes chart reading easier and decision making faster. For many traders, especially newcomers or those juggling multiple pairs, that simplicity is a genuine advantage.
However, Xmaster is not a magic tool. It cannot predict market-moving events. It cannot manage risk. It does not guarantee profit. Its outputs are only as useful as the trader using them. When markets are choppy, volatility is low, or fundamentals intervene, Xmaster’s signals can mislead.
Used thoughtfully, combined with higher time-frame context, price‑action, and disciplined risk control, Xmaster can be a solid component of a broader trading approach. If you are testing it, do so on demo first, keep a journal, and treat every trade as a hypothesis rather than a certainty.